
Home / Case studies / Core Web Vitals
Core Web Vitals work across six business websites
Six client websites, built and run by Techno Experts, went from 55 to 65 on mobile PageSpeed to 92 to 99. Scores, metrics, method and the original Google reports are all below.
Mobile PageSpeed at a glance
- Before55 to 65
- After92 to 99
- Agentic Browsing (mobile)3 of 3
The short answer
Techno Experts raised the mobile PageSpeed Insights performance score of six business websites from 55 to 65 to 92 to 99, a gain of 32 to 39 points per site. The sites run on WordPress, WooCommerce and Next.js and serve manufacturing, engineering, construction, retail, research publishing and sports e-commerce. All six pass the three Agentic Browsing checks on mobile.
- Websites
- 6
- Mobile before
- 55 to 65
- Mobile after
- 92 to 99
- Points gained
- +32 to +40
- Measured with
- PageSpeed Insights
- Platforms
- WordPress, Next.js
Results
Score by website
Each ring shows the mobile performance score today. Tap “See the report” to jump to the Google screenshot for that site.
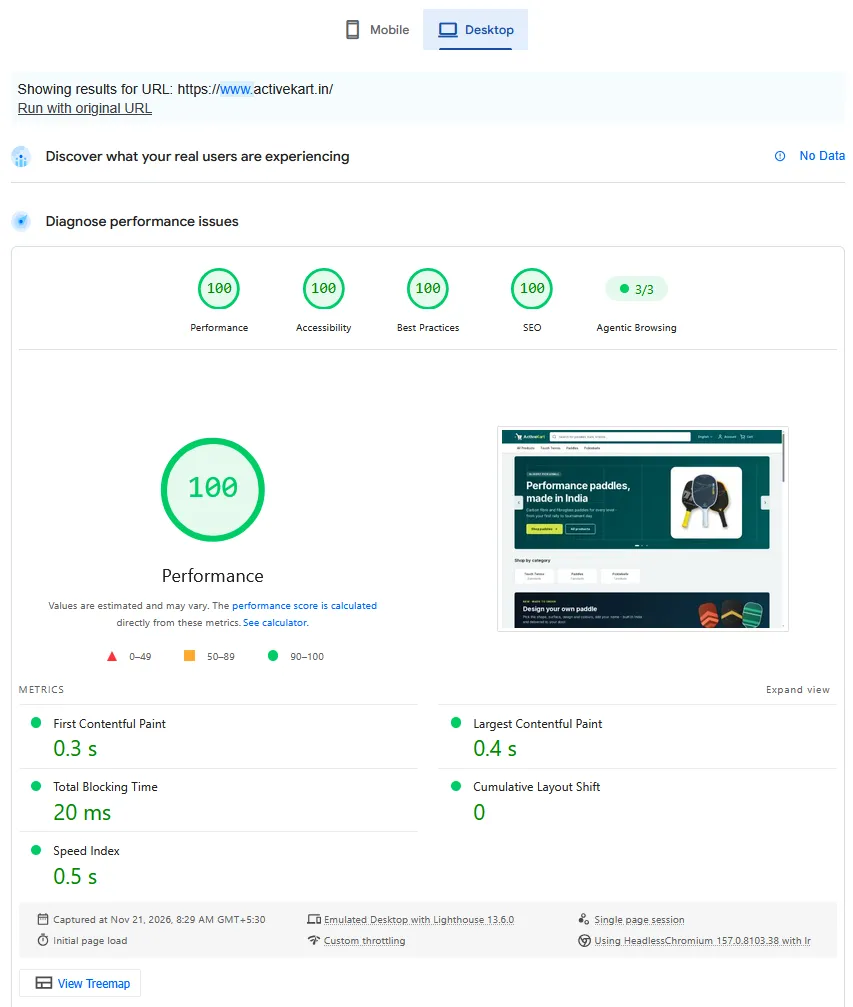
ActiveKart
Racket sports marketplace (Next.js)
- Desktop 70 to 100
- LCP 2.3 s
- TBT 0 ms
- CLS 0
Tested 21 Nov 2026 and shown in the screenshots below.
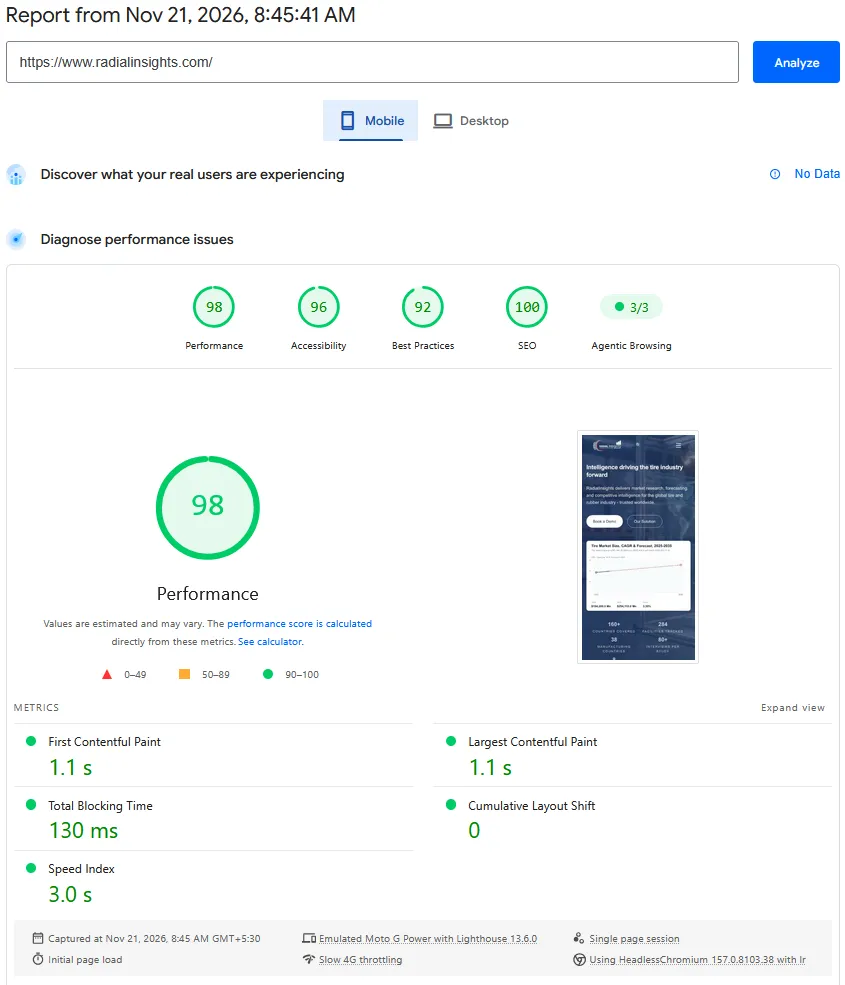
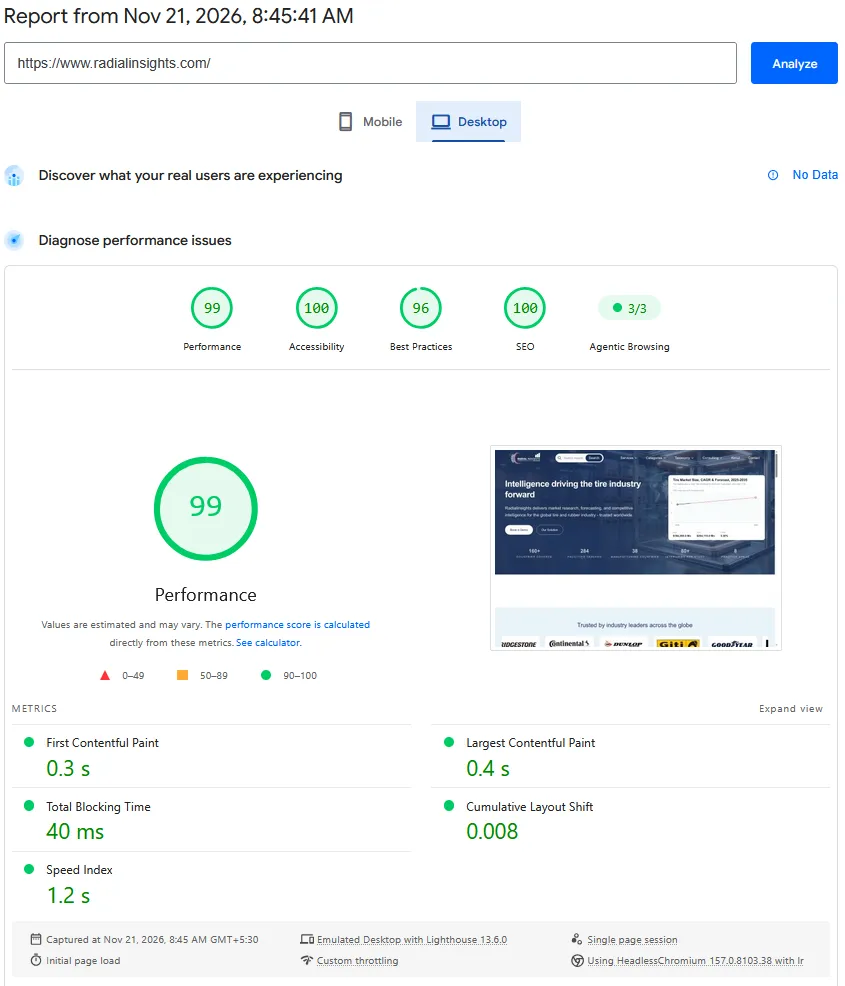
Radial Insights
Tire and rubber industry research publisher (Laravel and Next.js)
- Desktop 70 to 99
- LCP 1.1 s
- TBT 130 ms
- CLS 0
Tested 21 Nov 2026 and shown in the screenshots below.
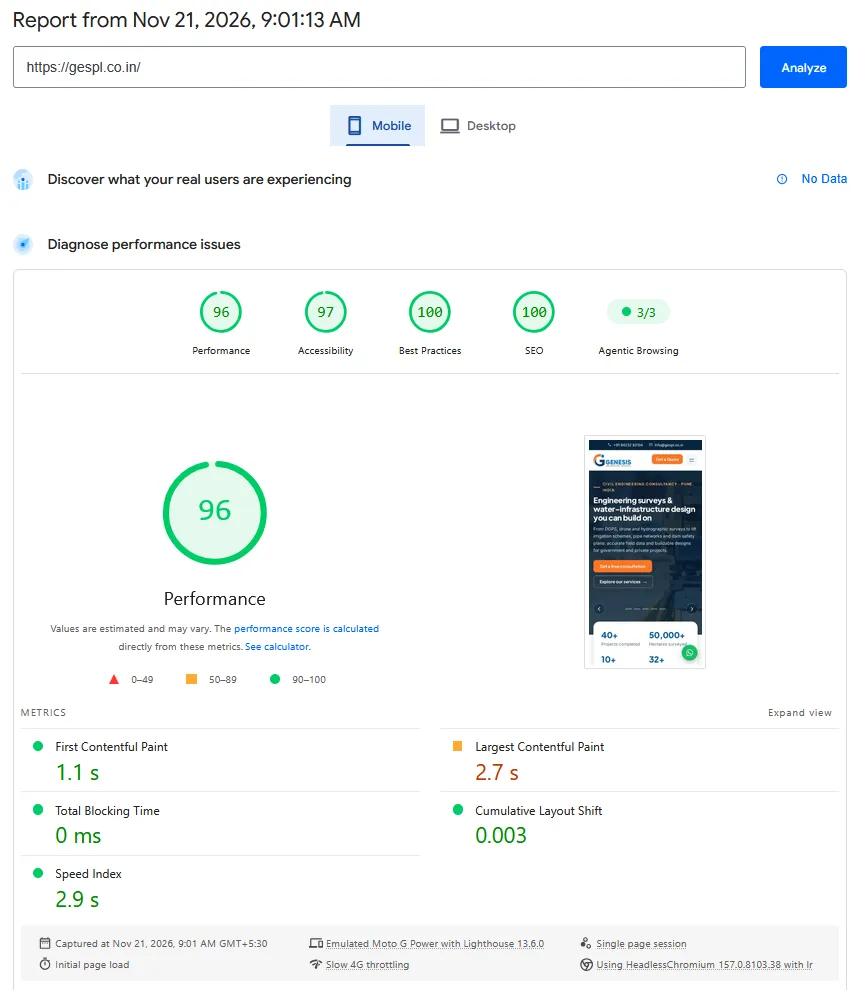
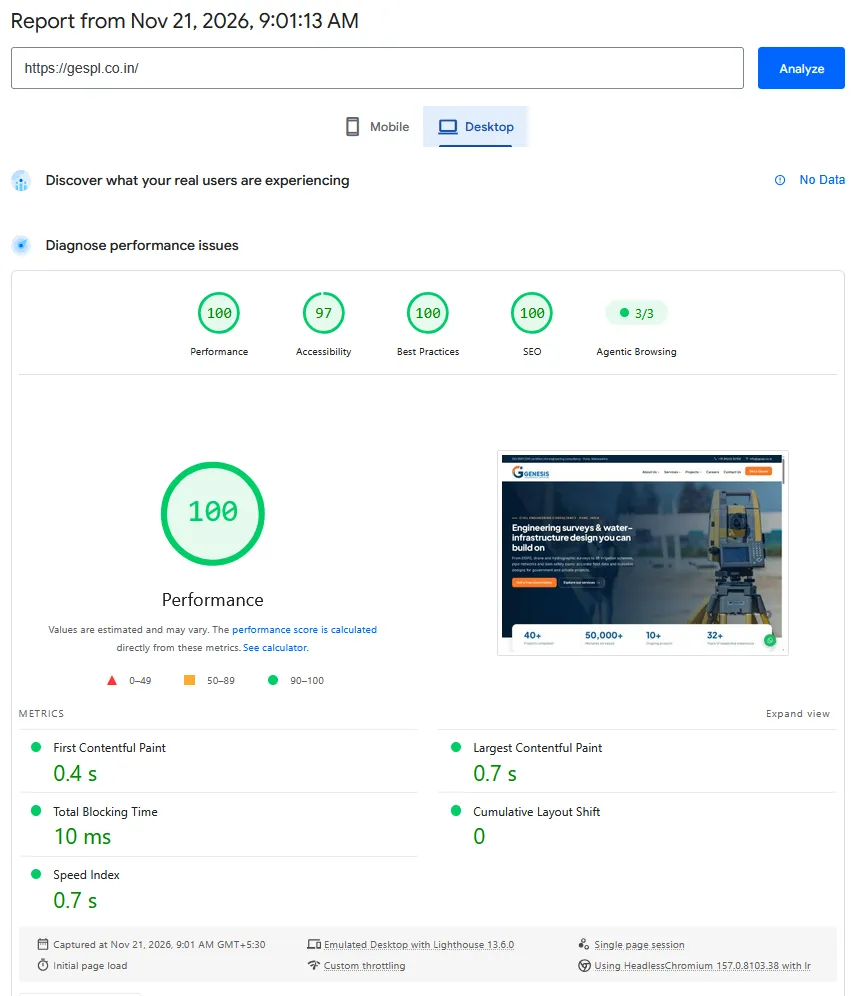
Genesis Engineering Services
Survey and irrigation consultants, Pune (WordPress)
- Desktop 100
- LCP 2.7 s, still above 2.5 s
- TBT 0 ms
- CLS 0.003
Tested 21 Nov 2026 and shown in the screenshots below.
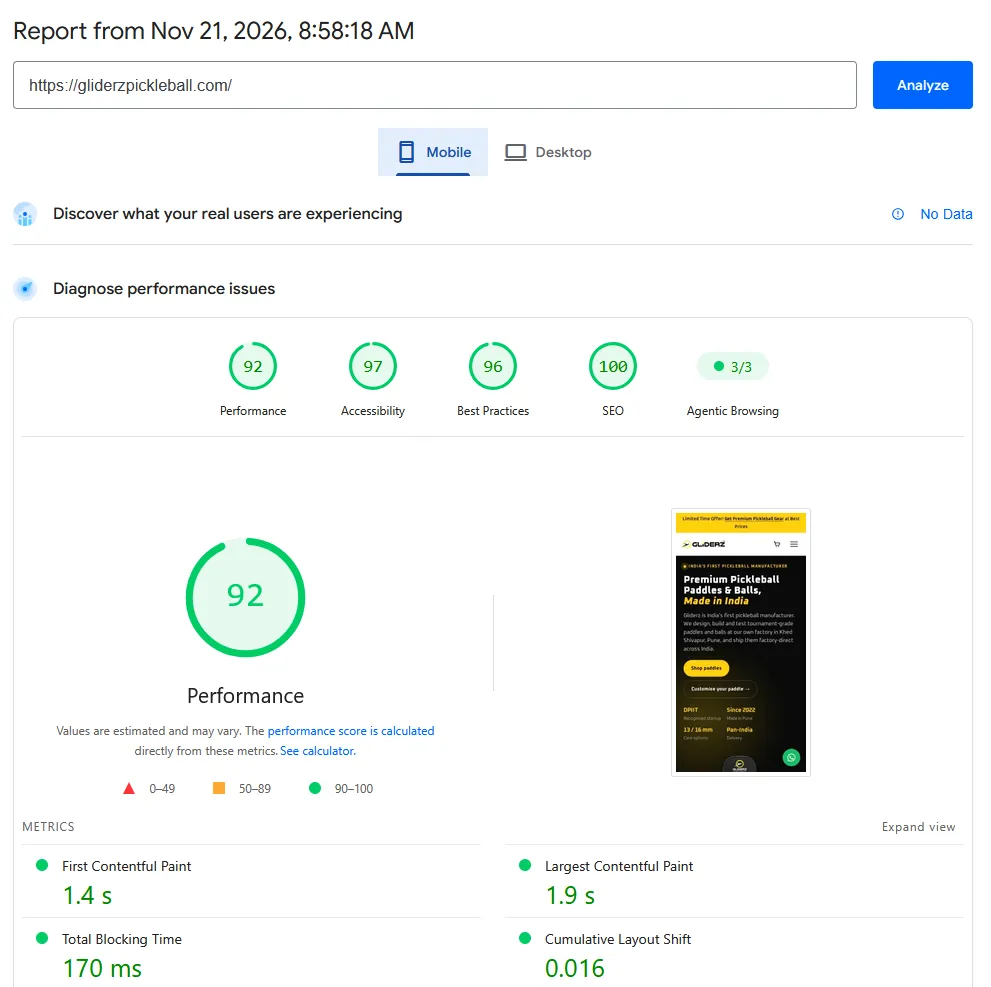
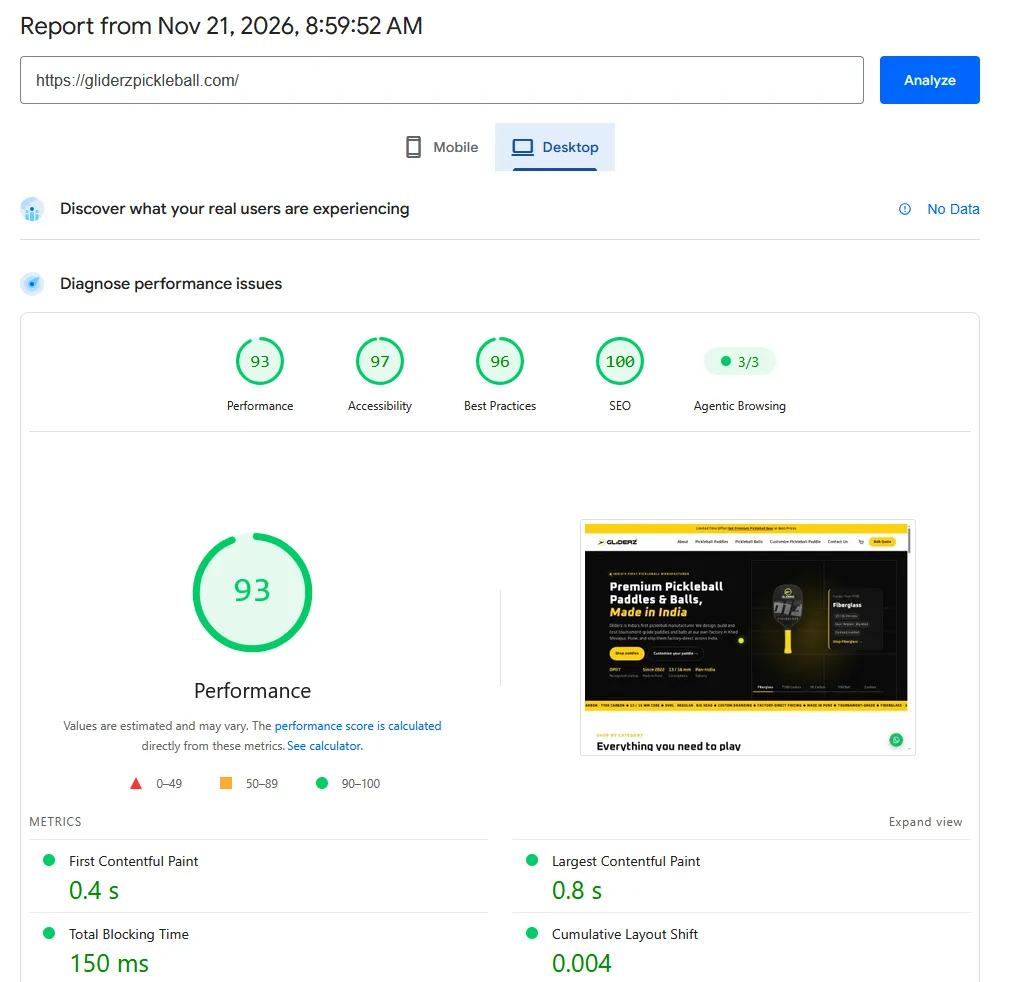
Gliderz
Pickleball paddles and balls store (WordPress and WooCommerce)
- Desktop 93
- LCP 1.9 s
- TBT 170 ms
- CLS 0.016
Tested 21 Nov 2026 and shown in the screenshots below.
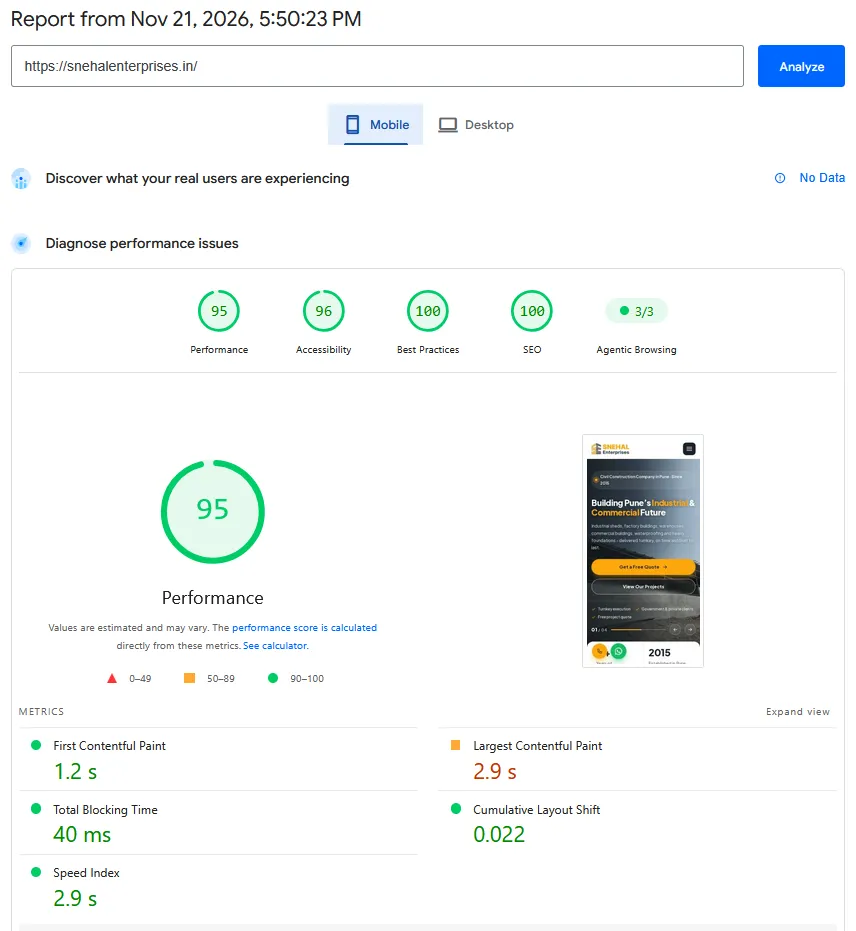
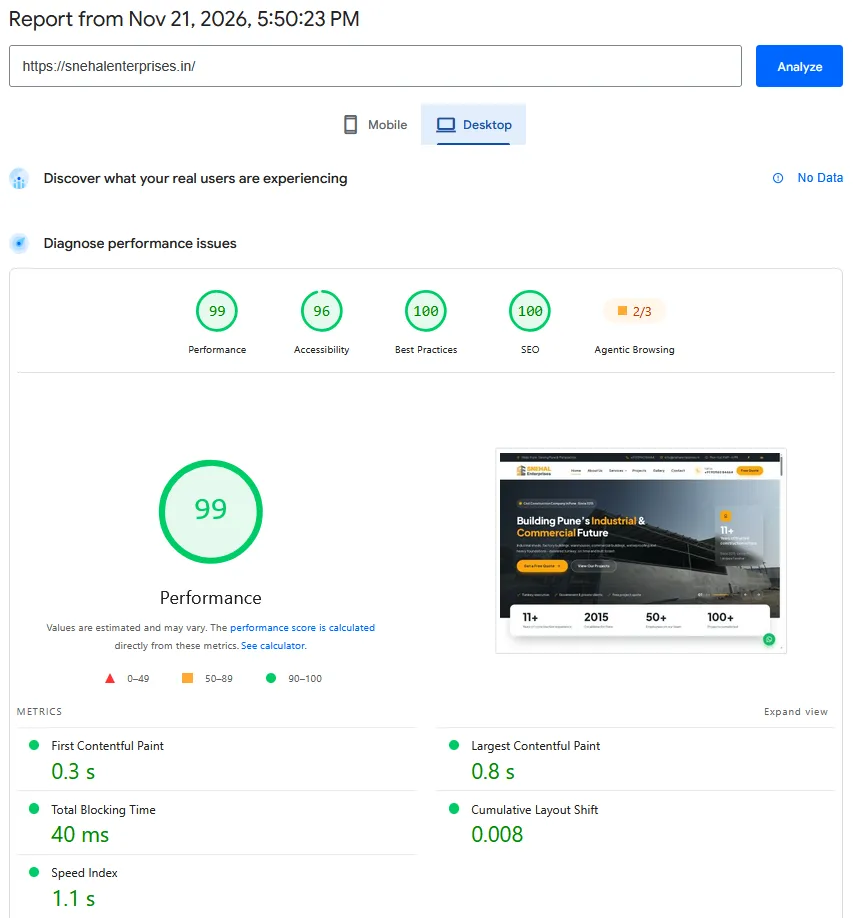
Snehal Enterprises
Civil construction company, Pune (WordPress)
- Desktop 99
- LCP 2.9 s, still above 2.5 s
- TBT 40 ms
- CLS 0.022
Tested 21 Nov 2026 and shown in the screenshots below.
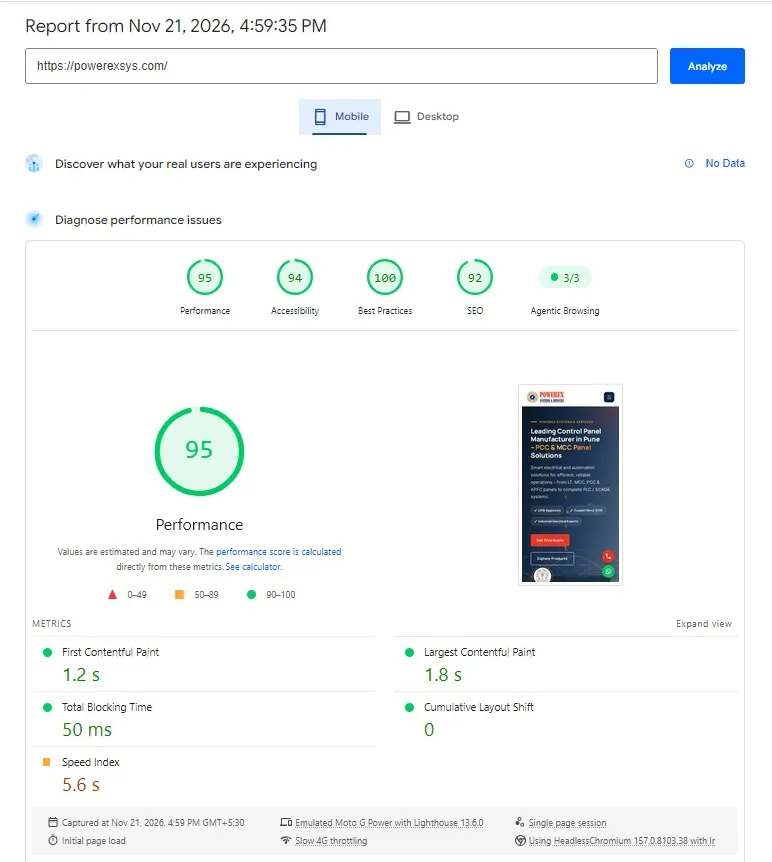
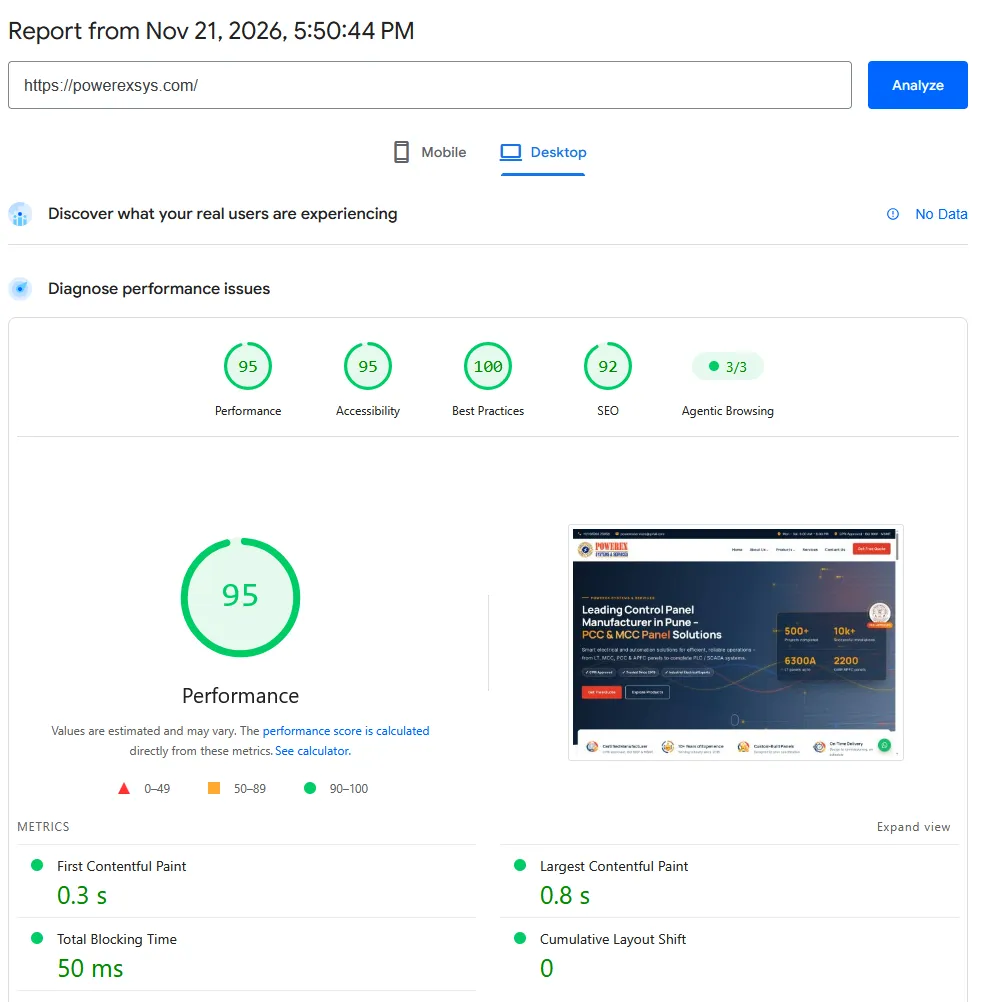
PowerEx Systems
Control panel manufacturer, Pune (WordPress)
- Desktop 95
- LCP 1.8 s
- Speed Index 5.6 s
- CLS 0
Tested 21 Nov 2026 and shown in the screenshots below.
| Website | Industry | Mobile before | Mobile after | Gain |
|---|---|---|---|---|
| PowerEx Systems | Control panels | 55 | 95 | +40 |
| Genesis Engineering Services | Survey and irrigation | 58 | 96 | +38 |
| Snehal Enterprises | Civil construction | 60 | 95 | +35 |
| Gliderz | Pickleball e-commerce | 60 | 92 | +32 |
| Radial Insights | Research publishing | 65 | 98 | +33 |
| ActiveKart | Sports marketplace | 60 | 99 | +39 |
Proof
The Google PageSpeed Insights reports
Pick a site and device, or use the arrows or your keyboard arrow keys to move through all twelve reports. Click an image to enlarge it.
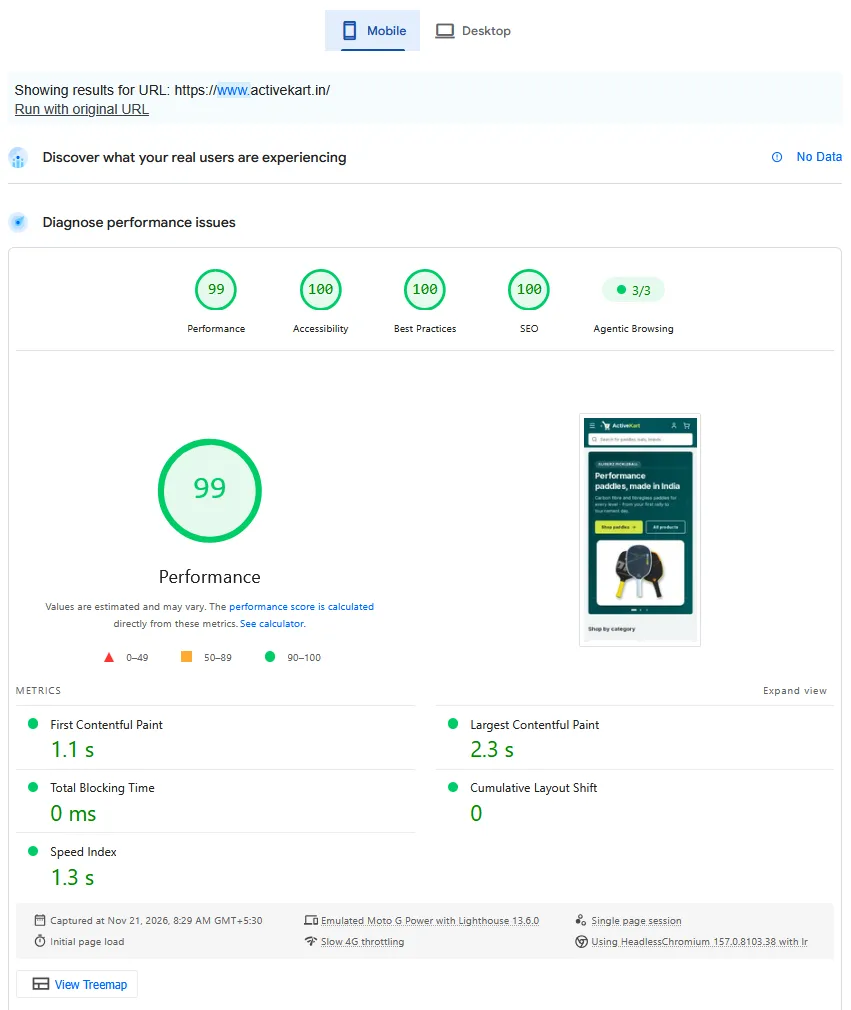
Reports captured on 21 November 2026 in Google PageSpeed Insights. Mobile uses an emulated Moto G Power on slow 4G.

The problem and the approach
Why these sites needed work
Each site scored only 55 to 65 on mobile PageSpeed. Slow pages lose visitors and weaken search performance, and mobile visitors on slower networks feel it most. For shops and enquiry sites, every extra second costs orders and leads.
- 01
Measure first
We test real pages with PageSpeed Insights and note the key metrics: Largest Contentful Paint, Cumulative Layout Shift and Total Blocking Time.
- 02
Fix the biggest causes
We deal with heavy images and fonts, render-blocking scripts, caching and server response, in order of impact.
- 03
Re-test and keep it fast
We test again after each change and keep watching the scores, so new content or plugins do not undo the gains.
Reading the numbers
What good looks like
Google’s Core Web Vitals thresholds
| Metric | Good | Poor |
|---|---|---|
| Largest Contentful Paint (LCP) | 2.5 s or less | over 4 s |
| Interaction to Next Paint (INP) | 200 ms or less | over 500 ms |
| Cumulative Layout Shift (CLS) | 0.1 or less | over 0.25 |
PageSpeed performance score
- 90 to 100: good
- 50 to 89: needs improvement
- 0 to 49: poor
PageSpeed Insights also shows Total Blocking Time (TBT), a lab measure that stands in for responsiveness when no real-user data exists.
Method and limits
How we measured, and what is still open
Method
- Tool: Google PageSpeed Insights, performance score.
- Mobile tests run on an emulated Moto G Power with slow 4G throttling. Desktop tests run on emulated desktop.
- Latest after-tests for all six sites: 21 November 2026, with the Google reports shown above.
- Before scores come from our own records. The after scores are in the Google reports shown above.
- These are lab results. Google shows no real-user (field) data for these addresses yet, so we do not claim a field Core Web Vitals pass.
Where there is still room
- Genesis: mobile LCP is 2.7 s, above the 2.5 s target.
- Radial Insights: mobile Best Practices is 92 and Accessibility is 96.
- Gliderz: mobile Total Blocking Time is 170 ms.
- PowerEx Systems: mobile Speed Index is 5.6 s.
- Snehal Enterprises: mobile LCP is 2.9 s, above the 2.5 s target, and desktop Agentic Browsing passes 2 of 3 checks.
- Lab scores move a few points between runs. Treat each score as a range, not a promise.
Questions
Common questions
What is a good PageSpeed score?
Google rates 90 to 100 as good, 50 to 89 as needs improvement and 0 to 49 as poor. All six sites in this case study now score 92 or higher on mobile.
Does a score of 90 mean the site passes Core Web Vitals?
Not by itself. The PageSpeed score is a lab result. The Core Web Vitals assessment uses real-user field data for LCP, INP and CLS, and a site needs enough visitors to have that data.
Why is the mobile score usually lower than desktop?
Mobile tests simulate a mid-range phone on a slow connection, so heavy images and scripts cost more. That is why we optimise for mobile first.
Will a faster website rank higher on Google?
Page experience is one signal among many. Speed also helps visitors stay and enquire, so we treat it as a business result as well as an SEO one.
Do you work on both WordPress and Next.js websites?
Yes. This case study covers WordPress, WooCommerce and Next.js sites.
Can you get my website above 90?
Often, but it depends on the theme, plugins, hosting and content. We test first and tell you what is realistic. Our free website health check is a good first step.
Why do the scores change when I test again?
PageSpeed Insights estimates values on shared infrastructure, so results can vary by a few points between runs.
What is Agentic Browsing in PageSpeed Insights?
It is a separate check group shown beside the four main scores in the report. On mobile, every site in this case study passes all three of its checks. On desktop, five of the six do and Snehal Enterprises passes two of three.
Related projects



Is your website slow?
Enter your address. In about 20 seconds you will see what to fix first.